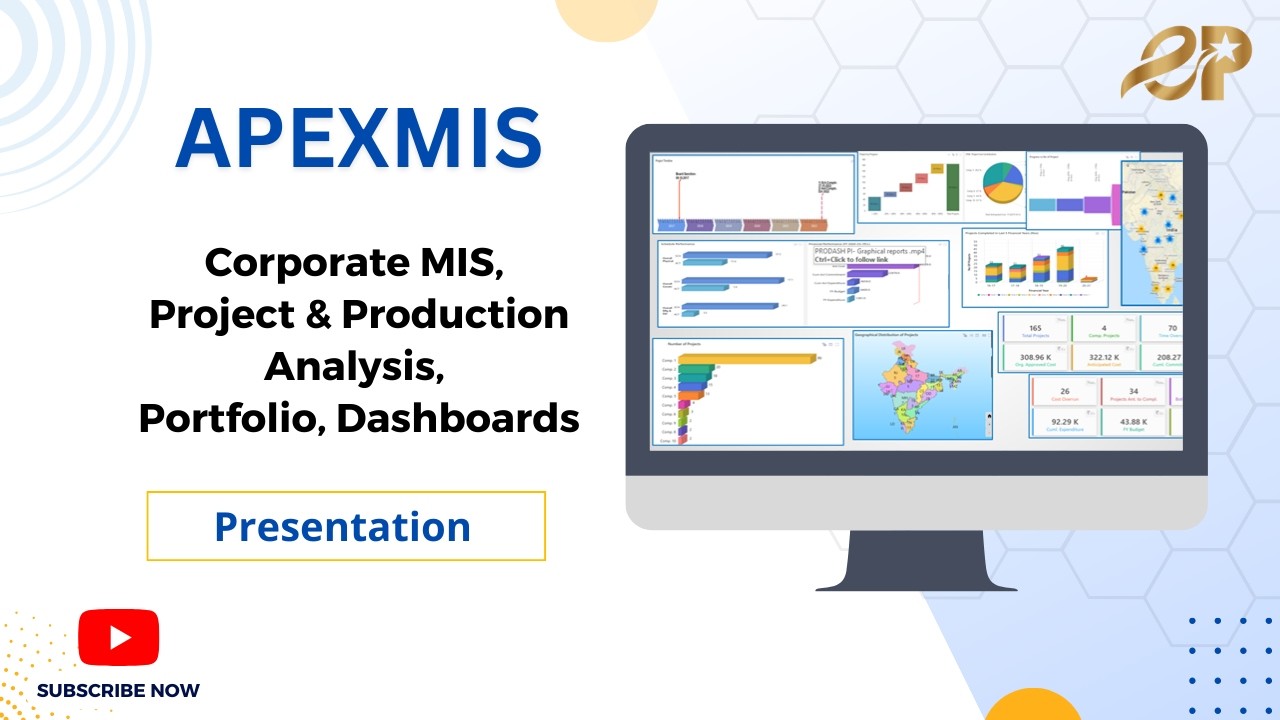
ApexMIS
A powerful platform providing graphical interactive analytical dashboards and reports for all project functions — schedule, cost, risk, HSE, quality, and finance.
Complete Visibility. Total Project Control.
APEXMIS transforms project data into powerful insights through interactive dashboards, helping organizations improve efficiency, reduce costs, and make smarter decisions.
Monitor schedule, cost, risk, HSE, quality, and finance — all in one centralized platform.
Built for Complex Industries
Used across Oil & Gas, Petrochemicals, Infrastructure, Manufacturing, Pipelines, and Construction — supporting all phases of project execution.
Features of ApexMIS
Unit & Project Dashboards
Unit-level and project dashboards provide a clear summary of key milestones, overall progress, and team performance.
Customized MIS Reporting
MIS reporting is customized based on industry, location, and other criteria for informed decision-making.
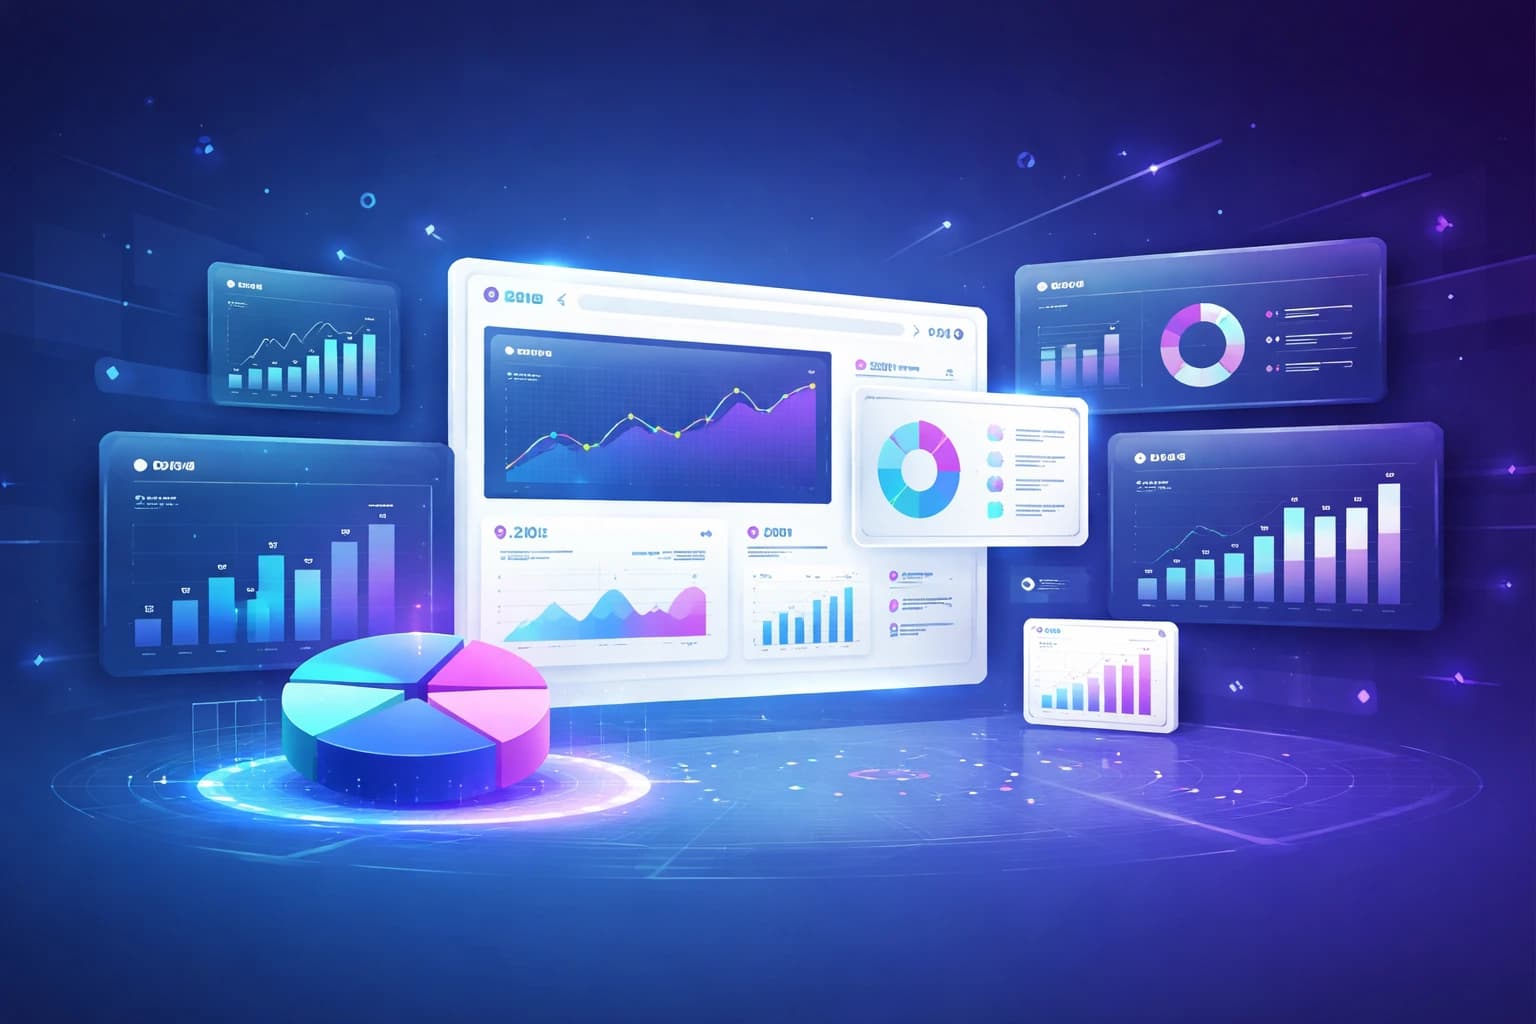
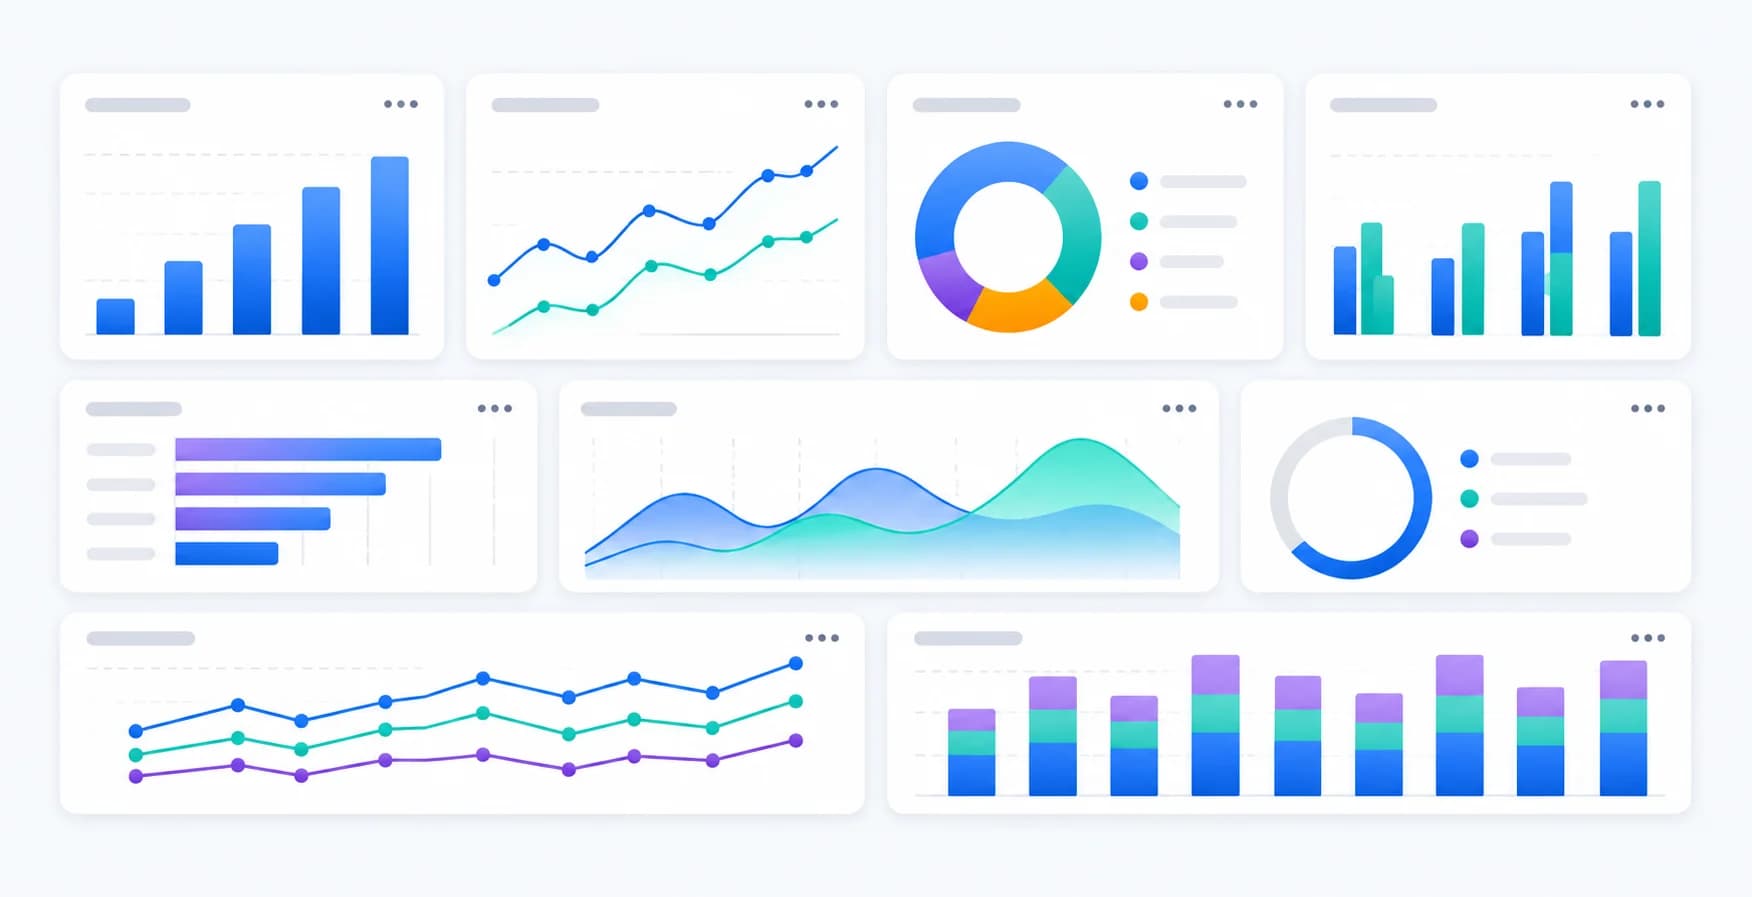
Advanced Data Visualization
Data analysis and reporting are available in multiple formats, including pie charts, histograms, scatter plots, ring charts, and profile curves.
Progress Tracking & Alerts
Project progress and performance matrices, exception lists for delays, 90-day lookaheads, and color-coded status bars (green/yellow/red) highlight issues needing attention.
High-Level Progress Overview
High-level progress charts display completed and remaining tasks across projects.
Centralized Collaboration
Stakeholders and project owners can post updates and track all active projects from a single dashboard.
Why Choose Us
Benefits
One platform built to reduce manual effort, improve visibility and keep your entire organization aligned.
Performance & Real-Time Insights
Improved company performance and faster decision making using streamlined ApexMIS data visualization techniques, transforming company data into real-time, metrics-rich visuals.
Actionable & Understandable Reports
Generates reports in formats easily understood and usable by all hierarchical levels of people.
Centralized Documents & Progress Tracking
All project documents are centralized and downloadable by authenticated users, with project progress cards accessible for any calendar date in one click.
Compare & Approve Project Data
Compare progress data while recording, reviewing, and approving project updates efficiently.
Interactive Project Management Dashboard
Watch how ApexMIS transforms complex EPC project data into clear, actionable intelligence — live, at a glance. ApexMIS — Live Preview
ApexMIS BROCHURE
Discover how Interactive Project Dashboards deliver deep insights into EPC projects — from planning to handover.
What Makes ApexMIS Exceptional
Discover the key capabilities that drive efficiency, visibility, and control for projects across industries.
Comprehensive MIS Reporting
APEXMIS supports top-level management with detailed reports on project progress, cost/schedule overruns, and variances.
Visual Representation of Metrics
Key monitoring parameters are displayed using engaging charts and curves for better understanding and faster decision-making.
Advanced Data Interaction
Drill-down and slice-and-dice features enable in-depth analysis of project data from multiple perspectives.
Sector, Client & Location Monitoring
Track projects based on sector, client, or location, with GPS-enabled maps for geographic visualization.
Dynamic & Graphical Insights
APEXMIS delivers pre-analyzed data graphically, dynamically reflecting real-time project status.
See The ApexMIS in Action
Schedule a personalized demo with our team and see ApexMIS in action.